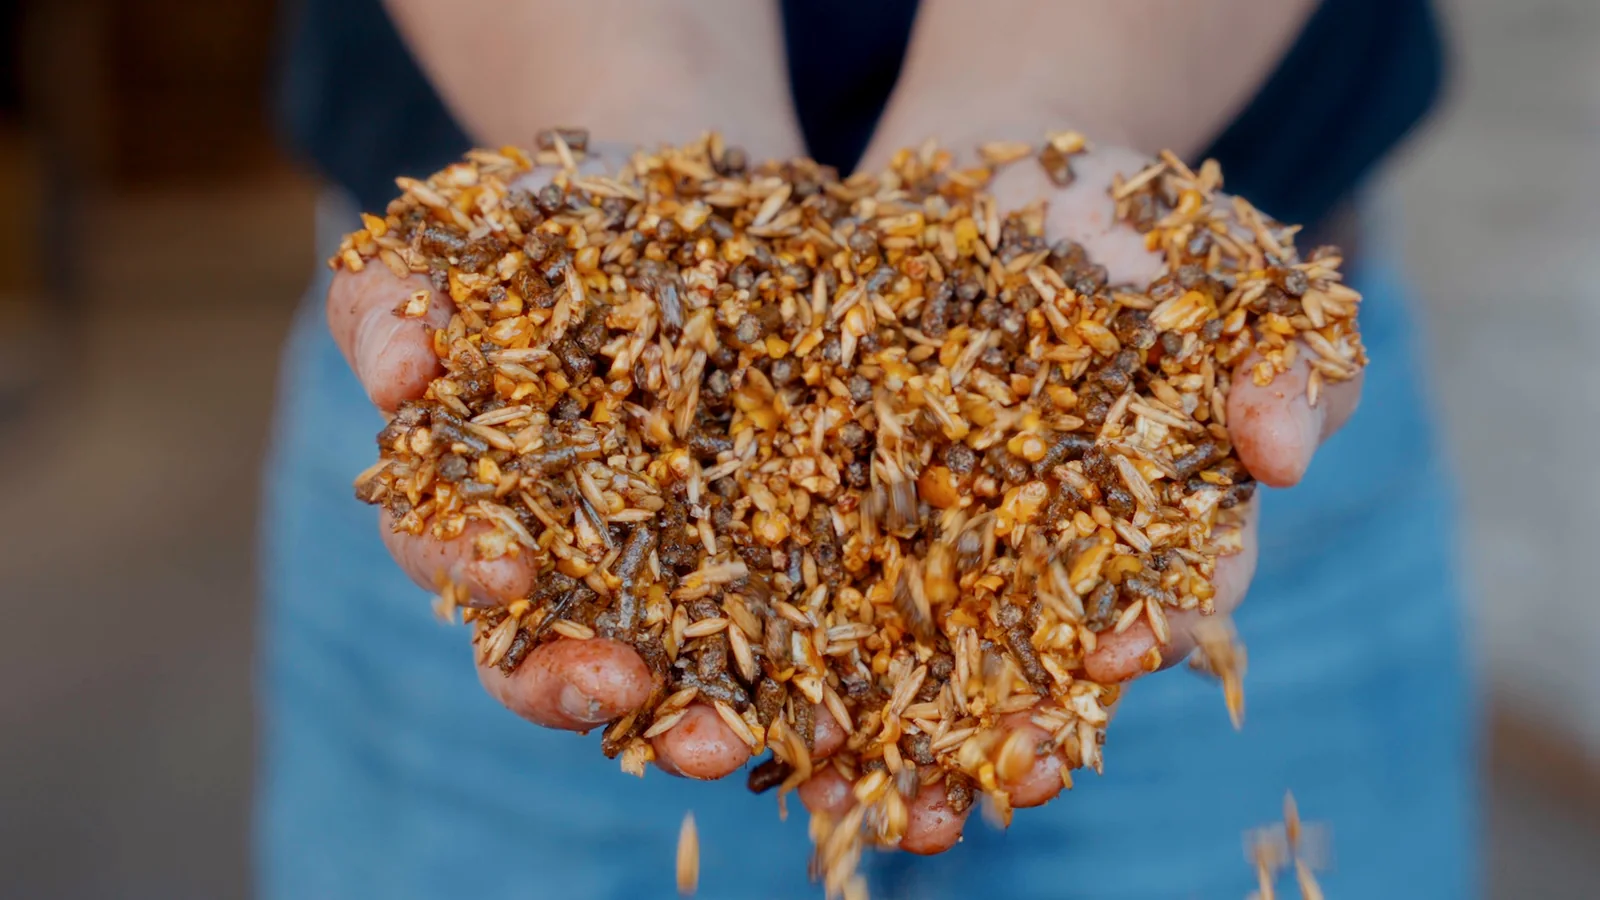
Digestible energy, in numbers
Horse feed energy check
Corn and wheat are the most energy-dense ingredients a horse feed is built on. See the highest DE a feed can reach without added fat, and how much oil and fat it takes to claim more.
Show energy in
No added fat or oil
Without added fat, nothing beats pure grain
Pure corn, as fed
1.55 Mcal/lb
Corn as it comes from the bin, 88.1% dry matter.
Pure corn, dry matter
1.76 Mcal/lb
The same corn with the water taken out.
Rolled wheat ties corn as fed (1,553 vs 1,551 kcal/lb, because it is a little drier) and falls just short on dry matter. Every other ingredient is lower, apart from the fats, flaxseed, and molasses (a liquid fed at a few percent).
These are the best case: a bag of pure grain. A real horse feed carries fiber, protein meals, minerals and vitamins, all lower in energy, so it lands well under these figures. A higher DE claim needs added fat, and enough of it to show in the crude fat guarantee. Values: NRC, Nutrient Requirements of Horses (2007), Table 16-6.
Add oil
Corn (cracked, ground or steam-flaked) + 0.0% vegetable oil
100.0%BaseCorn (cracked, ground or steam-flaked)
0.0%Added oilVegetable oil
DE as fed
1.55 Mcal/lb
DE dry matter
1.76 Mcal/lb
Crude fat, as fed
3.7 %
Dry matter
88.1 %
Check an advertised DE
Check a feed tag
The most DE a tag allows
Feed tags list ingredients from most to least by weight. Enter a tag’s ingredients in the printed order and its guarantees, and the check finds the highest DE any recipe that fits them could have.
1 · Ingredients, in the order printed
Stop at the first vitamin, mineral or additive (salt, limestone, monocalcium phosphate, a premix): they carry little or no energy. If an ingredient isn’t listed, pick the closest one, or the higher-energy one when unsure.
2 · Guarantees, as printed
Leave blank what the tag doesn’t state. Crude fiber isn’t used, because the NRC table gives NDF and ADF instead.
DE of common horse feed ingredients
Source: National Research Council, Nutrient Requirements of Horses, 6th revised edition (National Academies Press, 2007), Table 16-6. In Mcal/lb. Dry matter is the share of the ingredient that is not water; as-fed figures include the water.
| Ingredient | Dry matter | DE, dry matter | DE, as fed | Crude fat, as fed |
|---|---|---|---|---|
| Grains | ||||
| Corn (cracked, ground or steam-flaked)Top grain | 88.1% | 1.76 | 1.55 | 3.7% |
| Wheat, rolledTop grain | 89.4% | 1.74 | 1.55 | 2.1% |
| Milo (grain sorghum) | 88.6% | 1.70 | 1.51 | 2.7% |
| Barley, rolled | 91.0% | 1.66 | 1.51 | 2.0% |
| Oats, whole (38 lb/bu) | 89.0% | 1.51 | 1.34 | 4.6% |
| Oats, rolled | 90.0% | 1.48 | 1.33 | 4.6% |
| Oats, whole (32 lb/bu) | 91.0% | 1.47 | 1.33 | 4.5% |
| Grain byproducts & molasses | ||||
| Cane molasses | 74.3% | 1.84 | 1.37 | 0.1% |
| Hominy feed | 88.5% | 1.69 | 1.50 | 3.7% |
| Dried bakery product | 84.7% | 1.68 | 1.43 | 8.0% |
| Wheat middlings | 89.5% | 1.54 | 1.38 | 4.0% |
| Corn gluten feed | 89.4% | 1.54 | 1.38 | 3.1% |
| Rice bran | 90.6% | 1.52 | 1.38 | 13.8% |
| Wheat bran | 89.1% | 1.46 | 1.30 | 3.8% |
| Distillers dried grains with solubles | 90.2% | 1.36 | 1.22 | 9.0% |
| Brewers grains, dried | 90.7% | 1.29 | 1.17 | 4.7% |
| Protein meals & oilseeds | ||||
| Soybean meal, 48% | 89.5% | 1.69 | 1.51 | 1.0% |
| Soybean meal, 44% | 89.1% | 1.60 | 1.42 | 1.4% |
| Soybean meal, expeller | 89.6% | 1.59 | 1.42 | 7.3% |
| Soybeans, whole, roasted | 91.0% | 1.48 | 1.35 | 17.3% |
| Cottonseed meal | 90.5% | 1.35 | 1.22 | 1.7% |
| Canola meal | 90.3% | 1.33 | 1.20 | 4.9% |
| Linseed (flax) meal | 90.3% | 1.29 | 1.17 | 1.5% |
| Sunflower meal | 92.2% | 1.10 | 1.01 | 1.3% |
| Fiber feeds | ||||
| Citrus pulp, dried | 85.8% | 1.29 | 1.11 | 4.2% |
| Beet pulp, with molasses | 88.0% | 1.29 | 1.13 | 1.0% |
| Beet pulp, plain | 88.3% | 1.27 | 1.12 | 1.0% |
| Alfalfa meal, 17% | 90.3% | 1.10 | 1.00 | 2.3% |
| Soybean hulls | 90.9% | 1.02 | 0.93 | 2.5% |
| Cottonseed hulls | 89.0% | 0.77 | 0.68 | 2.2% |
| Hay | ||||
| Alfalfa (legume) hay, early cut | 84.2% | 1.19 | 1.00 | 1.8% |
| Alfalfa (legume) hay, mid-maturity | 83.9% | 1.10 | 0.92 | 1.7% |
| Cool-season grass hay, early cut | 84.0% | 1.07 | 0.90 | 2.8% |
| Grass–legume mixed hay, mid-maturity | 85.3% | 1.04 | 0.89 | 2.0% |
| Cool-season grass hay, mid-maturity | 83.8% | 0.99 | 0.83 | 2.1% |
| Oat hay | 85.0% | 0.98 | 0.83 | 1.9% |
| Cool-season grass hay, mature | 84.4% | 0.93 | 0.78 | 1.7% |
| Coastal bermudagrass hay | 87.1% | 0.85 | 0.74 | 2.4% |
| Fats, oils & flaxseed | ||||
| Vegetable oil (soybean, corn) | 100.0% | 4.17 | 4.17 | 99.9% |
| Tallow | 99.8% | 4.16 | 4.16 | 99.6% |
| Flaxseed, whole or ground | 93.0% | 2.68 | 2.49 | 35.6% |
How this is calculated
Ingredient values are from the National Research Council’s Nutrient Requirements of Horses (6th ed., 2007), Table 16-6: dry matter, DE in Mcal per kilogram of dry matter, and crude fat. The NRC calculates those DE values from each feed’s analysis with its published horse equations: for grains and other concentrates DE = 4.07 − 0.055 × ADF; for forages, the equation of Pagan (1998); for fats and oils, the equation of Zeyner and Kienzle (2002). As fed = dry-matter value × dry matter. One kilogram is 2.2046 pounds; 1 Mcal is 1,000 kcal.
Added oil is vegetable oil at 9.19 Mcal/kg, 100% dry matter and 99.9% fat; tallow is within 0.2% of it. The mix is weighted by as-fed weight: DE as fed and crude fat add in proportion, and DE on a dry-matter basis is the mix’s as-fed DE divided by its dry matter. Molasses has a high dry-matter DE but is a liquid fed at a few percent, so it is not counted as a feed’s whole base.
The lowest crude fat for an advertised DE is solved exactly over every blend of the table’s ingredients, fats and flaxseed included. Energy and fat both add in proportion, so the leanest blend is always one ingredient alone or two mixed to land on the target; every such single and pair is checked. Fat inside ingredients (rice bran, roasted soybeans) counts the same as added oil. A crude fat guarantee is a minimum, so a feed can contain somewhat more fat than its tag states.
The tag check relies on the labeling rule that ingredients are listed in descending order by weight. Every recipe in that order is a blend of “equal parts of the first few ingredients,” so with the guarantees it forms a small region of possible recipes, and the highest DE on either basis sits at one of its corners; the check tests every corner, so its answer is exact for the ingredients chosen. Ingredients may take a zero share, and the guarantees are treated as the only limits, which can only raise the answer. Whole flaxseed is not in the NRC table: its composition is from the Flax Council of Canada’s Flax Feed Industry Guide, and its DE is a generous upper bound (its fat at vegetable oil’s value, the rest at corn’s), higher than any published figure.
Table values are averages, and many are calculated from composition rather than measured in horses; individual lots vary. They show what is physically possible, not what any one feed contains.